Ghidra Gang
Introduction
I like Ghidra. Ghidra very cool. I'm going to go through some nice aspects of Ghidra below. What I say is just meant to be some ramblings of mine related to what I like and don't like about Ghidra, along with some tidbits of good advice on how to get the most out of your NSA toolkit.
Why Ghidra?
While Ghidra is not the only tool you'll ever need for reverse engineering and binary analysis (I'm doing a terrible job shilling here), it has some pretty inherent advantages when compared to other popular all-in-ones. It also has some not-so-good aspects to it as well. I've listed the ones I've found most important below:
Pros
Extensibility
Ghidra is completely free and open-source, with all of its source code (including decompiler) easily available online for your hacking pleasure. The only 2 AIOs that are widely in use currently are IDA and Binary Ninja, both of which are closed-source and so are only as extensible as their plugin system allows. On top of that, Ghidra exposes nearly every one of its features using its intermediate representation for machine language called pcode, so implementing a lifter for a new architecture to pcode is all you need to do in order to immediately receive all the benefits. In comparison, IDA does not support this kind of extensibility for new architectures and Binary Ninja doesn't give you as much for your labour.
Decompilation
Ghidra has what is arguably the best decompiler currently available. Unlike IDA, Ghidra's decompiler generates C-like code directly from the pcode intermediate language it generates. If you write or modify a lifter in Ghidra to support a new instruction or architecture feature, these changes will be immediately visible in the decompiler output. Binary Ninja has a similarly-extensible "decompiler", but I have to put the word in quotes because what tends to be produced is more similar to very marked-up disassembly than what you get from other decompilers.
Cons
Community support
Ghidra has only been available for 2 years and so has a smaller community writing extensions and plugins than IDA. However, with Ghidra's 10.0 release of both an emulator and debugger, more people are likely to switch over.
target-specific optimizations
While Ghidra can decompile many different architectures and produce useful C-like code, there are a lack of optimizations for different targets to aid in the produced output. For both IDA and Binary Ninja, there is more focus placed on the common targets that their users tend to look at, making their tooling better in that regard. IDA offers many options and optimizations when working with PE* executables, while as Binary Ninja avoids falling into the decompiler traps laid by malicious or obfuscated code. In some ways you can look at Ghidra more like a reverse engineering tool than a malware analysis or exploit development tool, though it can still do a very good job at both.
Java
ew :(
No seriously, this one hurts quite a bit. Due to Ghidra's entire front-end being written in Java, almost all extensions must also be written in Java. Fortunately for scripting there's Jython which allows us to access most of the Java state from Python, but it isn't intended for use in modifying any of the core components. Hopefully in the future the plugin system is expanded to support more languages, or at least to support Python3 and Kotlin internally.
Ghidra basics
Now that we've gotten the justification for being a Ghidra shill out of the way, I'm going to drop some info on how I choose to use Ghidra.
Layout
Ghidra allows you to save your tool in its current configuration so you can keep everything the same each time you use it. This is what my setup looks like currently:
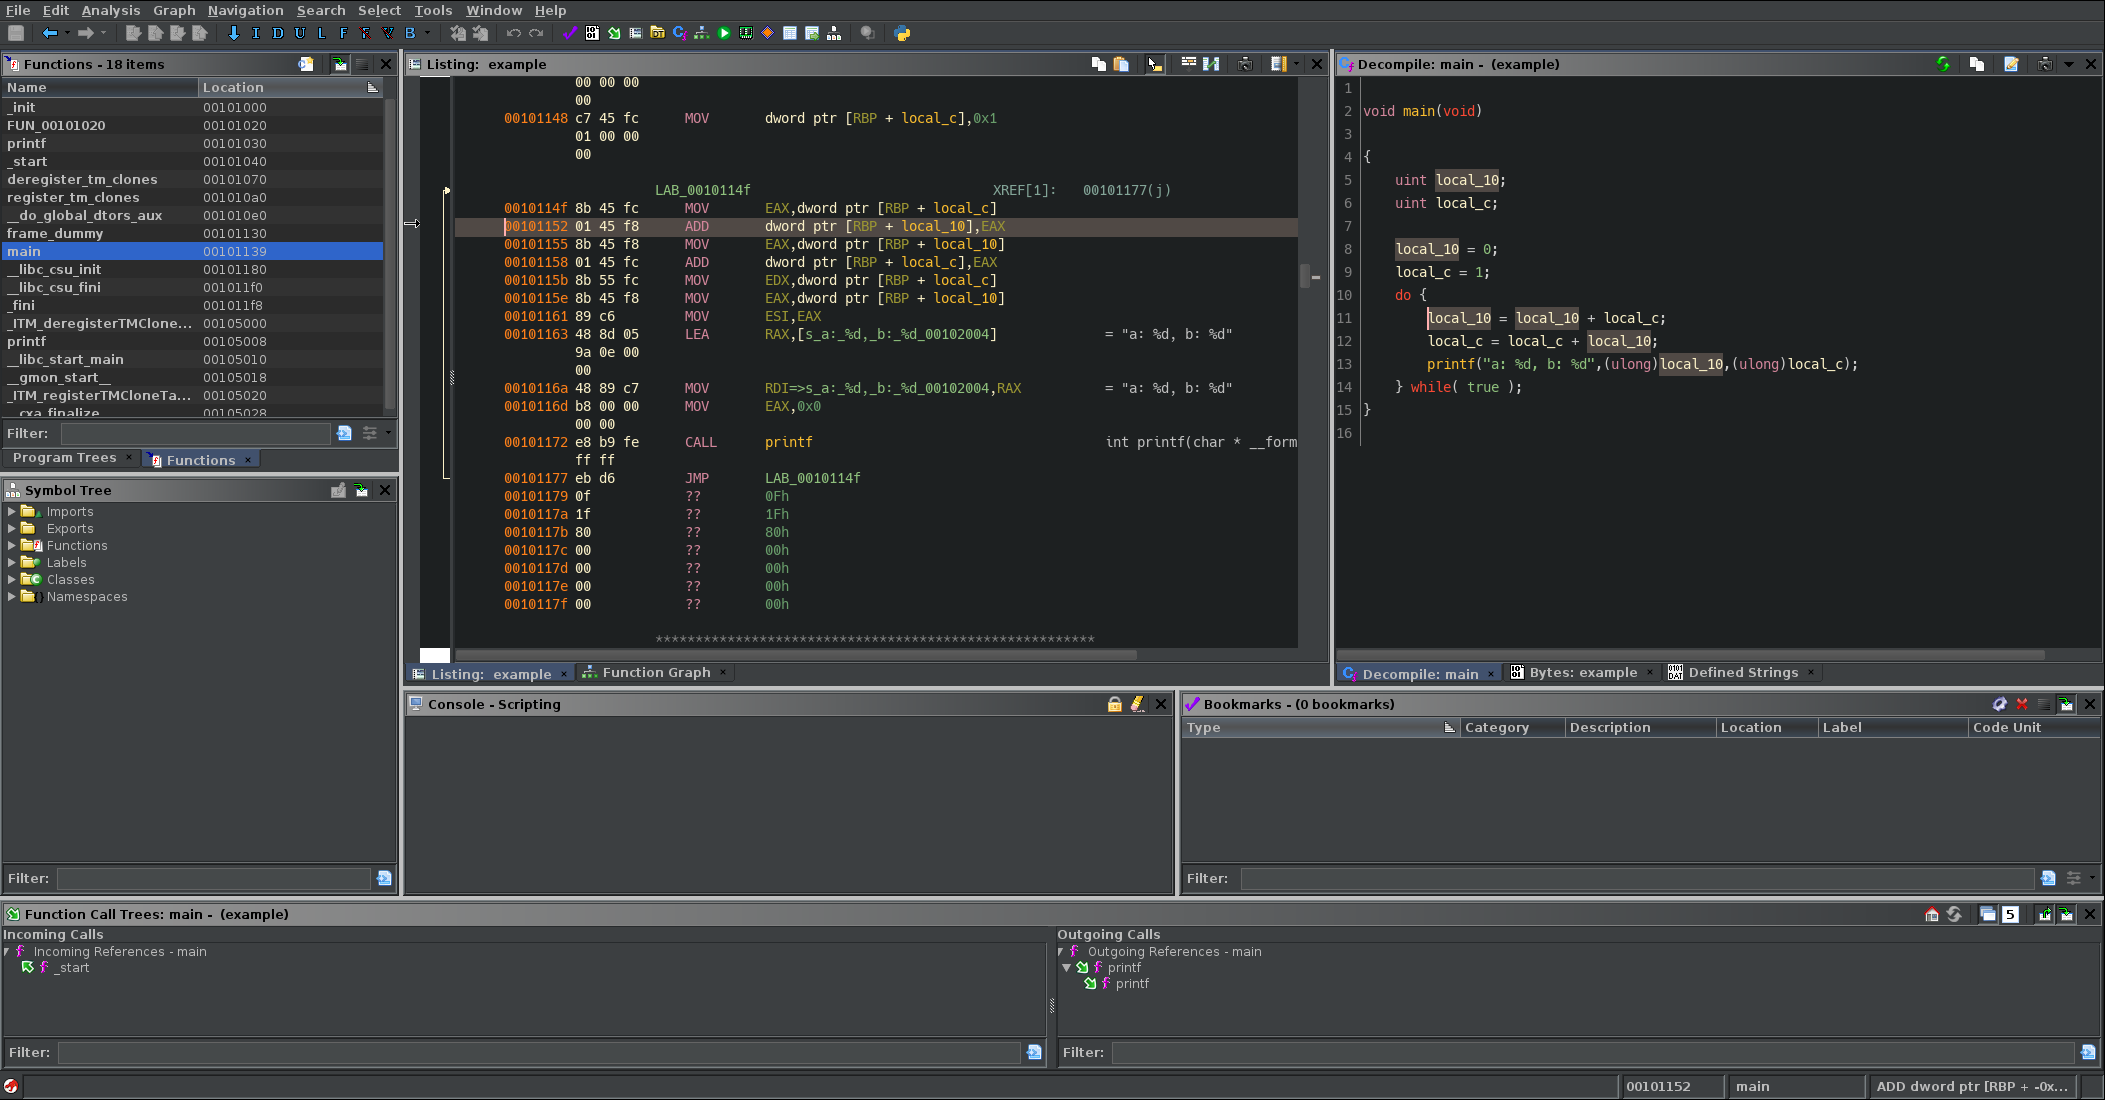
Aside from the default views, I always keep 2 additional windows visible on my screen: function call trees and bookmarks. Function call trees are great because they give you the fastest overview for the contents within the function you're currently viewing. While you might not see much benefit to this in a smaller program, being able to filter through functions reachable from the function you're currently in is a great feature for finding ways of reaching vulnerable code. I'll typically use this to show all paths reaching a function of interest and then iterate through each path to understand their behaviour. Bookmarks are always good to have right up front for encouraging you to add annotations to your code (which you should do often!). As I'm going through an interesting code path I'll typically drop bookmarks at key points so I can always come back quickly.
There's also some other useful views you might want to have up:
| graph view | if you're ok with a bit of jankiness and like visualizing the program control flow |
| strings view | great for finding starting points to look at in code, and Ghidra lets you filter on many properties of each string like what function it's in or where it's located |
| byte editor view | bit lacking compared to some dedicated hex editors, but still useful if you want to quickly change a couple bytes and see how it affects the decompiled output (you can also do this from the listing view) |
| structure editor | more on this one later |
| python view | same as above :) |
Also, in case you didn't notice, I'm using a custom dark mode patch for Ghidra to get a dark color theme. I help maintain an Arch User Repository package for installing Ghidra with this theme (which you can easily copy if you're not on Arch) and my entire color layout can be installed by adding this file to your Ghidra config via Ghidra main window->tools->import tool... (or this one for the debugger).
Keybindings
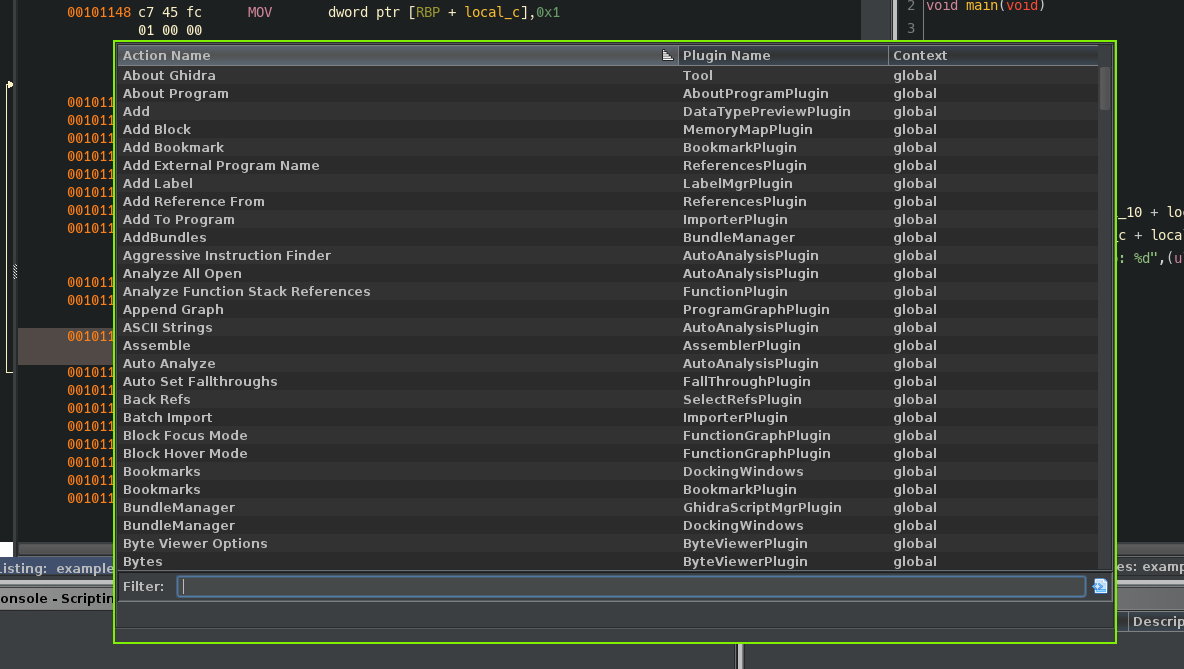
Keybindings are an important part of productivity within Ghidra. Most of the defaults are pretty good and I'm looking to give more advice and tips than a tutorial, so I'll skip the defaults and instead mention the keybindings I have that I find useful. One of my favorite custom bindings is to map "Next Function in History" to ">" and "Previous Function in History" to "<". It makes navigating back and forth through decompiled code more convenient than the default binding. I mostly use defaults outside of that, along with "Alt+P" to access my command palette plugin where I can reach most functionality in Ghidra from.
Type creator
Using correct types is the biggest hint you can give to a decompiler when it comes to improving the decompiler output, and Ghidra's type creation is one of the nicest basic features it has. This is even more true if you came from IDA and had to deal with its extremely rigid structure editor. While Ghidra's UI will sometimes give you an option to auto-create a structure for a variable, it can only create a structure as accurate as the information it infers. It also can't figure out when multiple variables are actually part of the same structure, as most binaries won't have any information indicating this. Luckily there's a simple and easy-to-use structure editor for creating new types and then setting them on variables yourself. You can access the structure editor when Ghidra isn't giving the option by going to Data Type Manager -> <current project> -> right-click -> New -> Structure.... I recommend keeping the window open so you can quickly jump back and make changes to structures when you need to.
Word of advice: always start creating types early and start from the inner functions that are used the most. If you start from the top and try to reverse out the entire state container without knowing the sizing of the structures it contains, you'll probably find yourself having to change parent structures you already configured in order to fix errors.
Scripting
Writing scripts is an important aspect of extracting useful information when reversing, but it always seems to have a steep learning curve attached. It doesn't help that Ghidra's scripting system doesn't have the best API and only supports Java (we won't talk about this one anymore after this) or Python2 directly. The UI is also pretty frustrating to use as you only get a basic python terminal or a plain text editor within Ghidra for creating and testing your scripts. I also didn't enjoy using the default system in Ghidra for writing scripts, so I went and played with some alternative extensions people made to see if I could improve my experience.
Scripting like a data scientist
One of the key features I think is missing from Ghidra's scripting system is the lack of attention put on experimentation. There's more of an emphasis on writing scripts so that they can be used for extending Ghidra, when in reality you'll probably just want to run some quick queries or one-time changes that are difficult to do from the UI. The best way I've found to write scripts is to use a Jupyter notebook attached to Ghidra, as that lets me test and get my results quickly. There are two good extensions for adding a Jupyter kernel to Ghidra (depending on whether you prefer Python or Kotlin):
-
ghidra jupyter kotlin: full functionality but somewhat unstable and you gotta learn Kotlin
-
ghidra python bridge: you get python3 but you have to use slightly different syntax for long-running commands or face a performance penalty
I personally use the python bridge with Jupyter notebook or org-mode in Emacs like so:
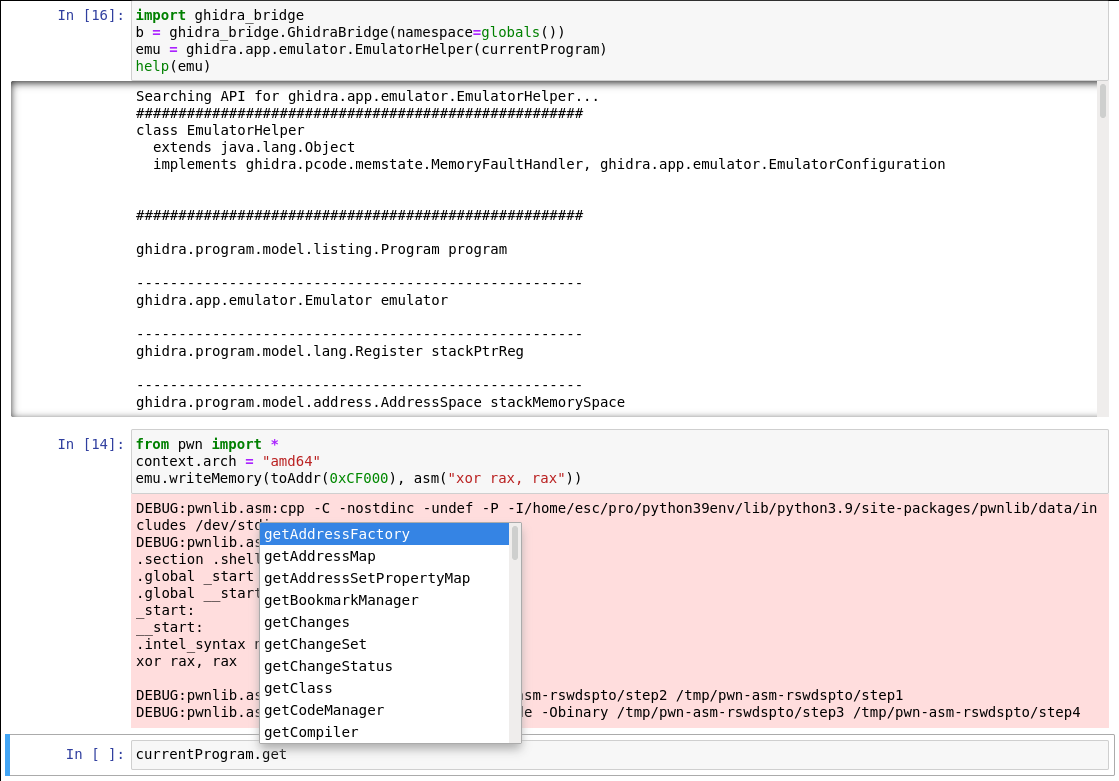
Note that your most important resource when writing scripts is by far looking at the flat program API docs on Ghidra's official website. From there you can the most common functionality - pray that you don't need much more because you'll probably have to scour the Ghidra API documentation or (if you're really unlucky) nested Java hell to find what you want.
Useful scripts
While experimenting or making one-off changes to a program in Ghidra are nice, there are also some good scripts that are worth adding to Ghidra and reusing. Here's a very small list of some scripts I've found were helpful in the past:
-
rabbit_hole.py: A script that appends cyclic complexity of functions to their name so you can tell what functions are more complex at a glance (and more accurately than just checking their size).
-
DefineUndefinedFunctions.java: takes all known undefined functions in Ghidra and defines them. This is actually FindUndefinedFunctionsScript.java from the core scripts that come with Ghidra but I modified it slightly to make it define the functions instead of just listing them. -
memcpy2stack.py: generates decompiled code for all functions within the current program and then searches for calls to memcpy with a stack buffer as an argument (though really this could be used for searching decompiled code for anything). You can achieve a similar but less automated functionality by exporting the program as C/C++ and then searching through those files yourself.from ghidra.app.decompiler import DecompInterface import re memcpy_symbol = getSymbols("memcpy", None)[0] memcpy_refs = getReferencesTo(memcpy_symbol.address) for ref in memcpy_refs: try: fn = getFunctionContaining(ref.fromAddress) decompInterface = DecompInterface() decompInterface.openProgram(currentProgram) res = decompInterface.decompileFunction(fn, 30, monitor) if res.decompileCompleted(): decomp_fn = res.getDecompiledFunction() # check if decompiled code contains a stack buffer as input if re.search("memcpy\(.*?[sS]tack.*?,.*,", decomp_fn.getC()): print("memcpy with stack dst found near: {}" .format(ref.fromAddress)) except Exception as e: print("error:", e) -
HighlightBlock.py: highlights blocks of the list of addresses you provide (goes nicely with a trace from a different tool like Unicorn)def color_block(block): if service: color = service.getBackgroundColor(block.getFirstStartAddress()) if color and color.getBlue() == 128: clearBackgroundColor(block) else: clearBackgroundColor(block) setBackgroundColor(block, Color.GRAY) def highlight_blocks(model, addrs): for addr in addrs: print addr b = model.getCodeBlockAt(addr, monitor) print "block: ", b if b: color_block(b)
I recommend taking a look through the scripts provided within Ghidra as well so you know what's already available to you. You can also find many more useful scripts on different online sources, like this aggregate repo of extensions for Ghidra.
Debugger
Oh boy, this one's still very new to me and I'm probably not aware of all the features available yet, but Ghidra 10.0 has officially released a snapshot-based debugger! It's still pretty rough right now, but already supports GDB, Windbg, and the JDI debugger. My main hope with this debugger was that it would make it easier to introspect machines by adding all the information collected during static analysis such as type information. For example, by attaching Ghidra to a QEMU instance emulating a full ARM SoC, I would like to be able to view the full state of that ARM machine and get decompiled output of dynamic code blocks and information on the values held within key structures in dynamic memory. Unfortunately, Ghidra has not added this type of functionality yet, but it would be a good area for future improvement.
What does work currently is debugging of local programs, with useful features to load type information and shared objects so that you can view the full execution of your program within the UI. Tracing and replaying also works, allowing you to record a trace of your binary running and then hopping back to a previous state to check the effects of the executed instructions or just to have another look. One major issue I experienced was not having a way to map a static memory section onto a dynamic memory section in case Ghidra loaded a module incorrectly, which also means attaching Ghidra to a running debugger isn't possible from the UI. Here's what my debugger setup currently looks like:
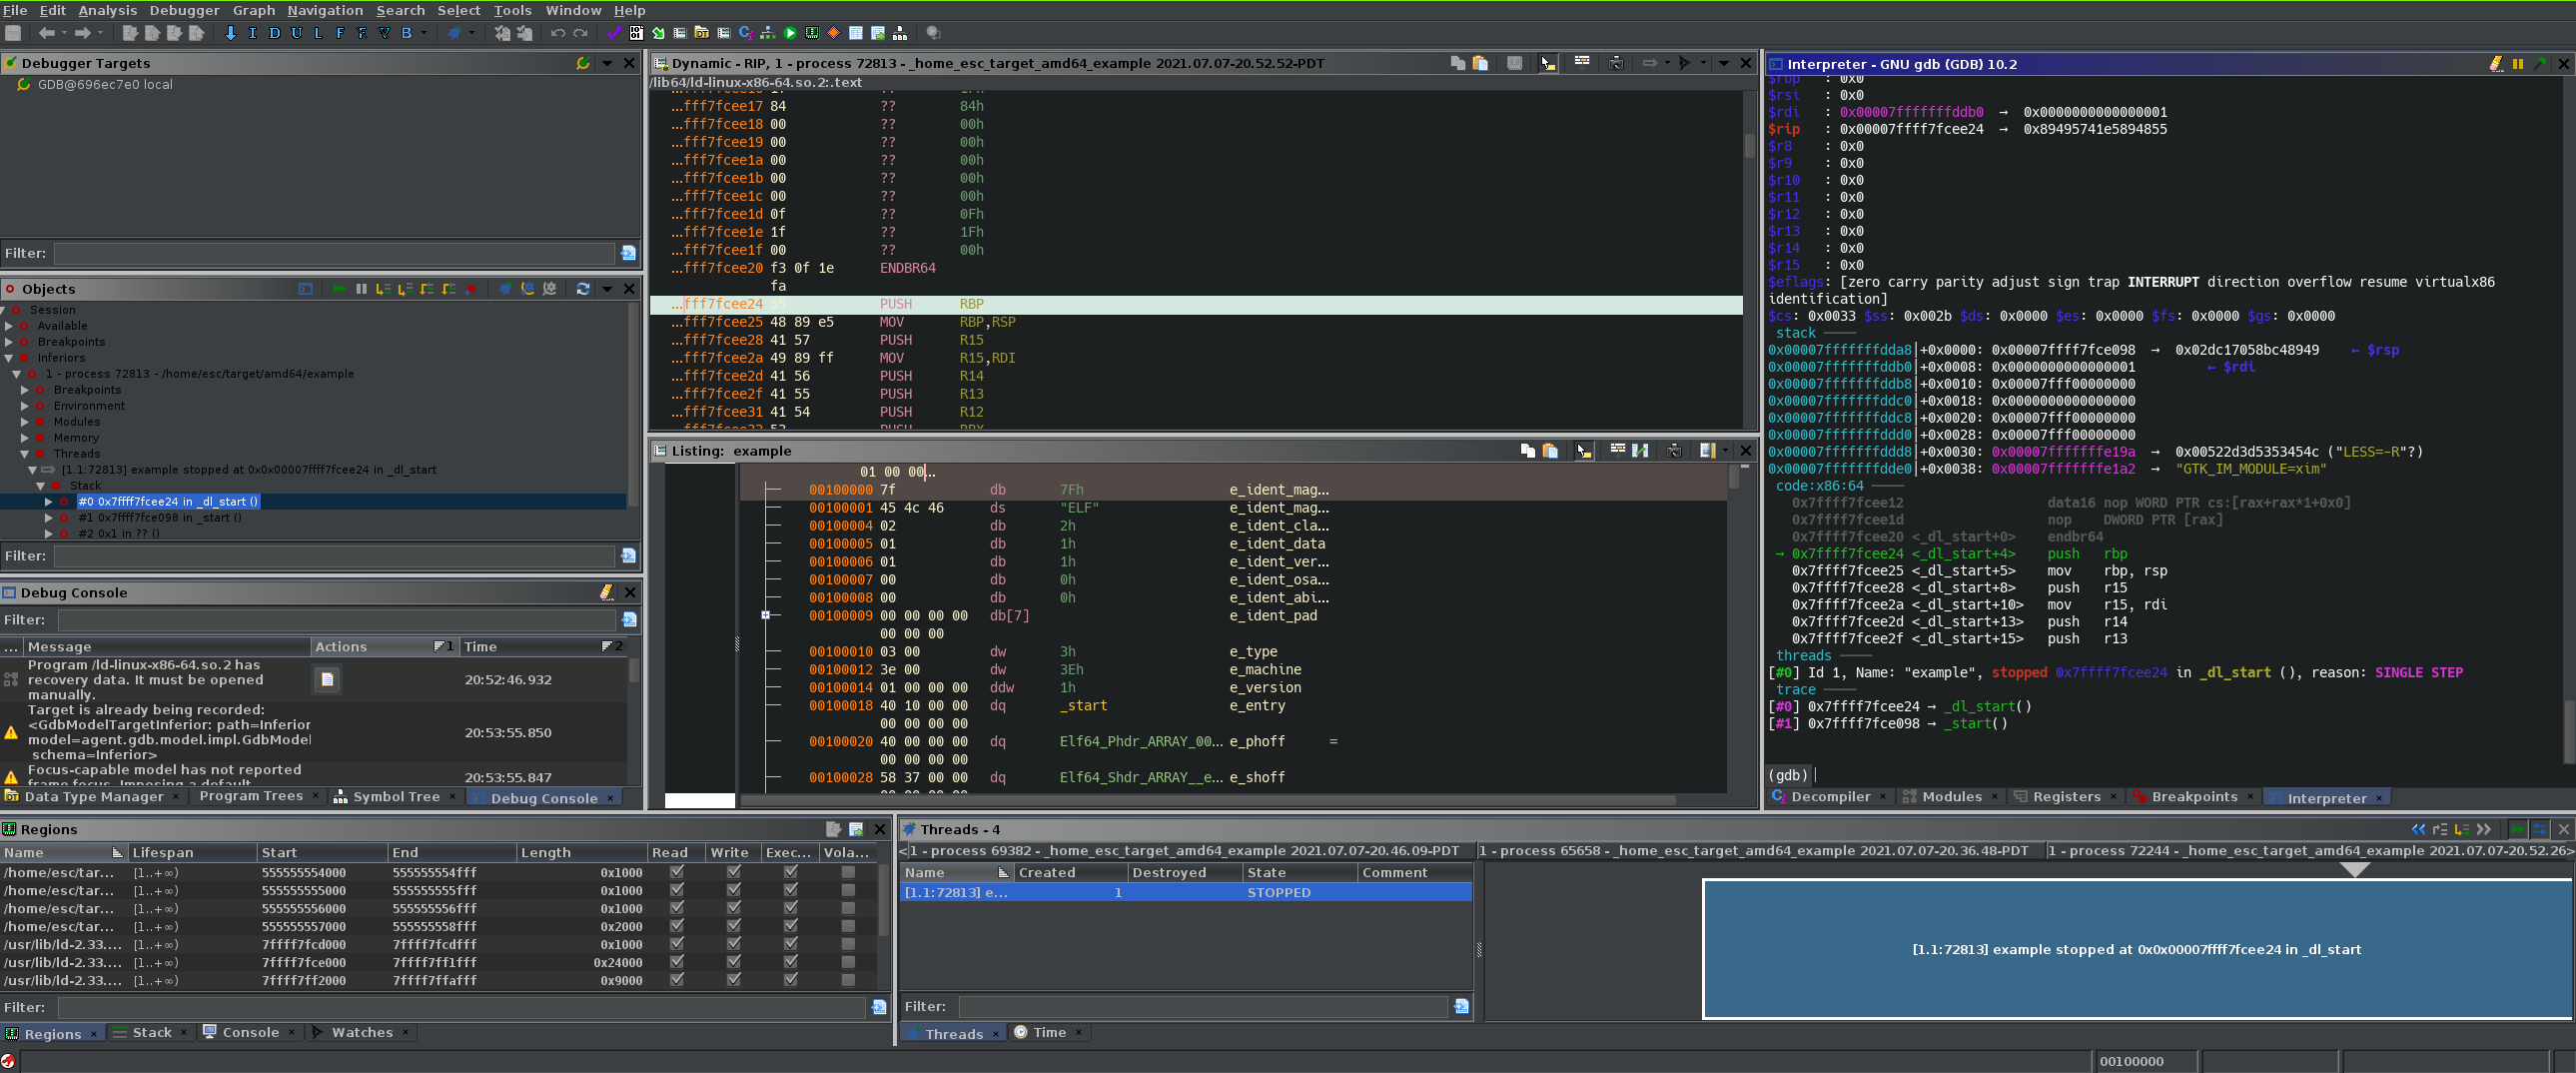
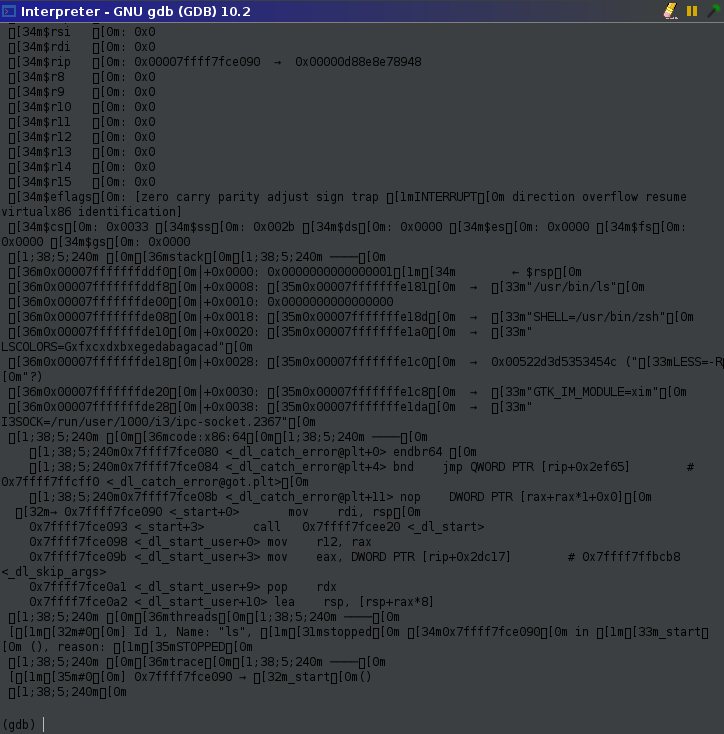
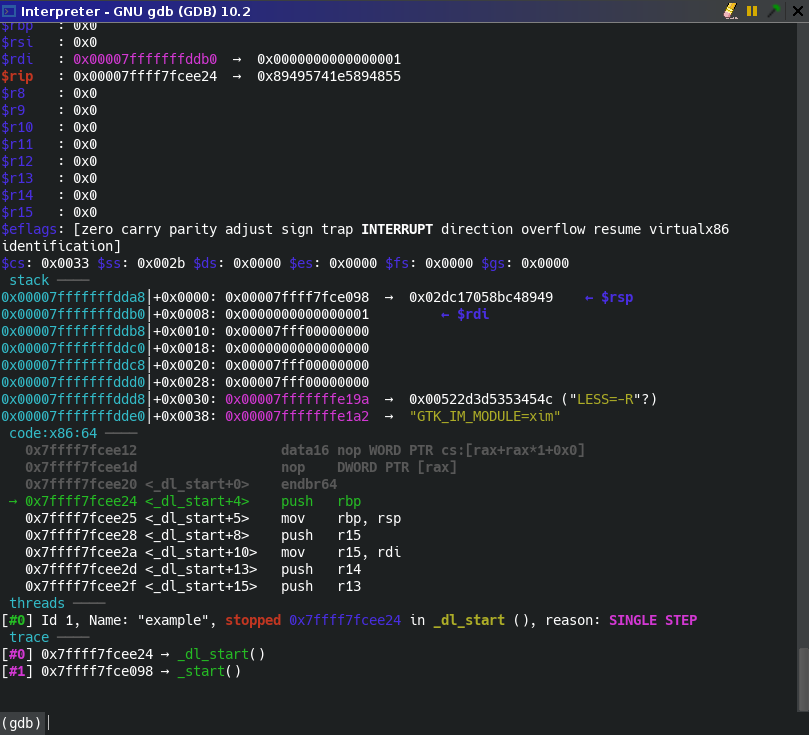
By default Ghidra's gdb view does not support ANSI colors, which leads to a messy and unreadable output. My CTF team leader Robert actually went and made a custom patch for adding ANSI color support, which you can install by placing the contents of the patch into $GHIDRA_INSTALL_DIR/Ghidra/patch. Placing class files in this directory will make Ghidra load them instead of the default files, meaning you can modify core Ghidra without having to run the entire Gradle build again.
Ghidra GDB before:
Ghidra GDB after:
Emulation
Ghidra's emulator is still mostly a toy so I wouldn't say it's an essential feature to learn at this time. However, once a faster backend than the existing one is made, Ghidra will likely be able to run any program at comparably-native speeds. Couple this with how modifiable you can make the effects of instructions, and I think we'll probably see entire machines and their state being emulated from within Ghidra. Even now the emulator can be useful for testing the output of small code blocks, though using a faster tool like Unicorn is probably a better idea.
Here's a small example to show how to use the emulator:
# create a new emulator instance
emu = ghidra.app.emulator.EmulatorHelper(currentProgram)

# set registers to their starting values
emu.writeRegister("RAX", 0x20)
emu.writeRegister("RSP", 0x2FFF0000)
emu.writeRegister("RBP", 0x2FFF0000)
# write a value into the emulator's memory
emu.writeMemory(toAddr(0xCF000), b"\xDE\xAD\xC0\xDE")
# read a value in memory
emu.readMemory(toAddr(0xCF000), 4)

# get the address of a symbol
main_addr = getSymbols("main", None)[0].getAddress()

# move PC to point at start of main
emu.writeRegister(emu.getPCRegister(), main_addr.getOffset())

# set our address to stop at
end_addr = toAddr(main_addr.getOffset + 62)

reg_filter = [
    "RIP", "RAX", "RBX", "RCX", "RDX", "RSI", "RDI",
    "RSP", "RBP", "rflags"
]

while monitor.isCancelled() is False:

    curr_addr = emu.getExecutionAddress()
    if (curr_addr == end_addr):
        print("Emulation complete.")
        return

    # Print current instruction and the registers we care about
    print("Address: 0x{} ({})".format(curr_addr, getInstructionAt(curr_addr)))
    for reg in reg_filter:
        reg_value = emu.readRegister(reg)
        print("  {} = {:#018x}".format(reg, reg_value))

    # single step emulation
    success = emu.step(monitor)
    if (success == False):
        lastError = emu.getLastError()
        printerr("Emulation Error: '{}'".format(lastError))
        return

# Cleanup resources and release hold on currentProgram
emu.dispose()
This really isn't that far off from how you would use a different CPU emulator such as Unicorn. Considering that Unicorn does direct guest-to-host instruction translation versus ghidra's Java-based emulation (Zzzz…) and has better overall support, it makes more sense to leave emulation like this to Unicorn (or Qiling if you need full-system emulation). Ghidra is significantly more hackable on its own than Unicorn though, so it's easier to add support for a new architecture or architecture-specific features. If a UI and faster emulation is added, I think Ghidra will probably before a major player in machine emulation.
Shameless plug
I likely mentioned the command palette plugin I use multiple times throughout this post. In case you need something like this in Ghidra as much as I did, check out my repo here and give it a try. In case you couldn't tell, I'm really not a fan of Java and writing this plugin hurt me emotionally and psychologically. The only thing that can make me go back and fix any bugs or add more useful features is your support so give the plugin a try and let me know if there's anything you think could be improved. :-)
That brings us to the end of this shilling session. I hope that I helped some of you submerge yourselves - not only in Ghidra - but into the world of reverse engineering. Also, if you're looking for ways to improve Ghidra, here a couple I could use:
-
enable the debugger's dynamic memory view to work even when
/proc/mapsis unavailable (this would solve a lot of issues for debugging in many emulators) -
better integration between Ghidra and Unicorn or (if you're really ambitious) adding a TCG backend for pcode so all machines in Ghidra can be emulated under Unicorn effortlessly
-
writing in WASM support to Ghidra so I never have to see another "we wrote a WASM lifter plugin for Binja to solve a CTF question" meme again
-
converting any popular IDA plugin into an equivalent Ghidra plugin to support the better team (in all seriousness please give IDA and binary ninja a try if you can or you won't even know what you're missing out on)
Resources
I've placed some resources I found useful or interesting projects that I didn't mention above down here.